States / New York
New York
Registration deadlines and voting rules: official guide for New York on vote.gov.
New York's government
State executive
Lieutenant GovernorAntonio DelgadoDemocraticSecretary of StateWalter MosleyDemocraticAttorney GeneralLetitia JamesState legislature
40 Democratic22 Republican1 vacant
103 Democratic47 Republican
Control: Democratic
Source: National Governors Association (retrieved November 21, 2026); National Lieutenant Governors Association (retrieved November 21, 2026); National Association of Secretaries of State (retrieved November 21, 2026); Office of the Attorney General of New York (retrieved November 22, 2026); National Conference of State Legislatures (retrieved November 21, 2026). The Attorney General is named on the office's own website, which does not give a party.
New York in the U.S. Congress
Who represents New York in Washington now. Open anyone to see their votes, bills, money and term dates.
Senate
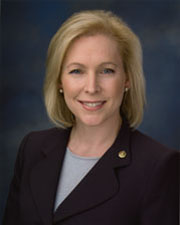
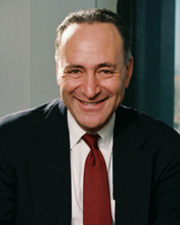
House of Representatives (26)
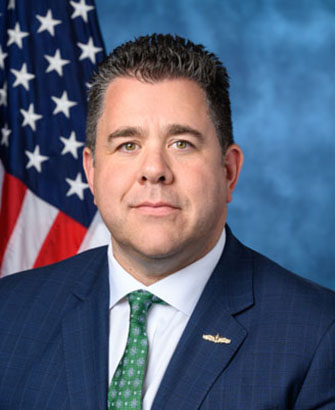 Nick LaLotaRepresentative, 1st districtRepublican
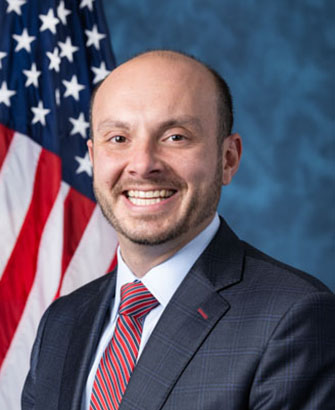 Andrew R. GarbarinoRepresentative, 2nd districtRepublican
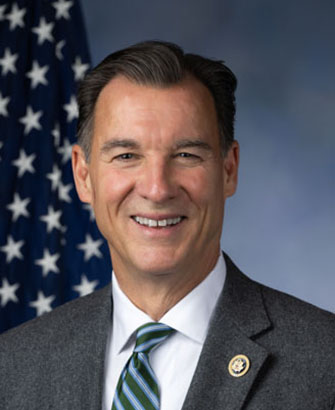 Thomas R. SuozziRepresentative, 3rd districtDemocratic
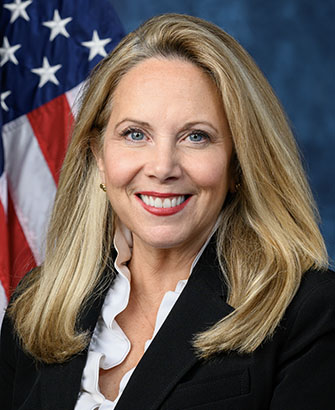 Laura GillenRepresentative, 4th districtDemocratic
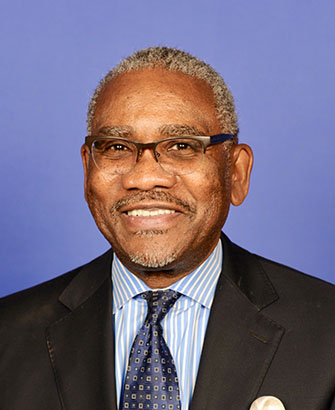 Gregory W. MeeksRepresentative, 5th districtDemocratic
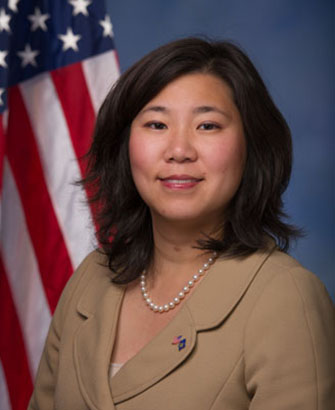 Grace MengRepresentative, 6th districtDemocratic
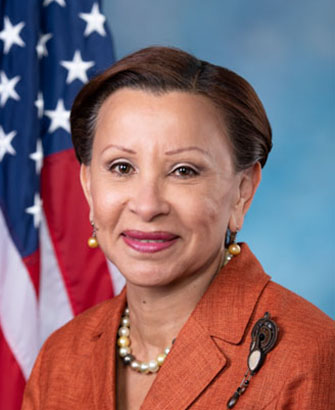 Nydia M. VelázquezRepresentative, 7th districtDemocratic
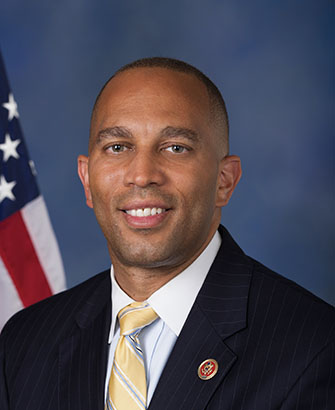 Hakeem S. JeffriesRepresentative, 8th districtDemocratic
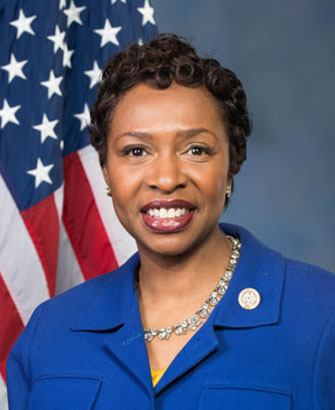 Yvette D. ClarkeRepresentative, 9th districtDemocratic
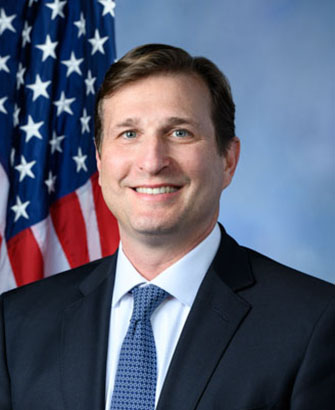 Daniel S. GoldmanRepresentative, 10th districtDemocratic
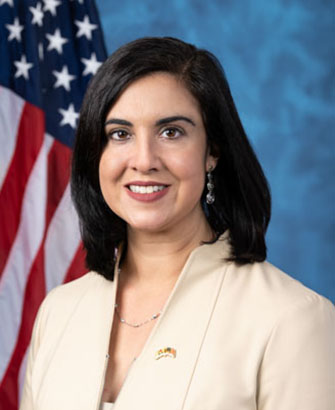 Nicole MalliotakisRepresentative, 11th districtRepublican
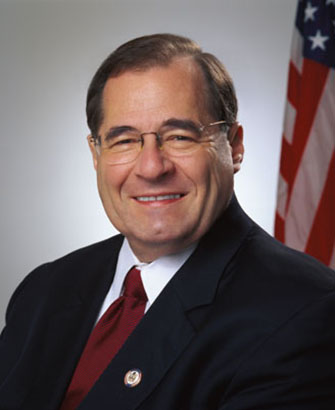 Jerrold NadlerRepresentative, 12th districtDemocratic
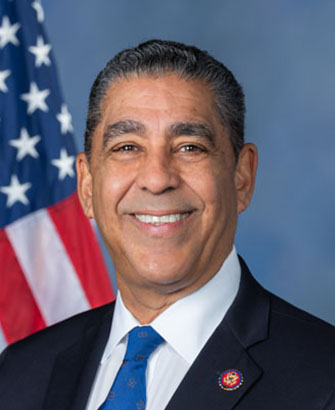 Adriano EspaillatRepresentative, 13th districtDemocratic
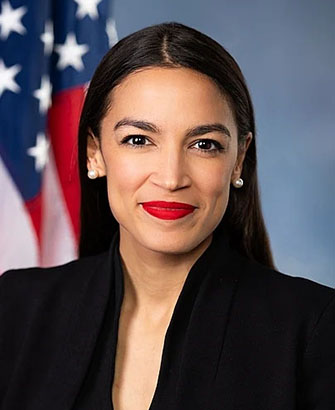 Alexandria Ocasio-CortezRepresentative, 14th districtDemocratic
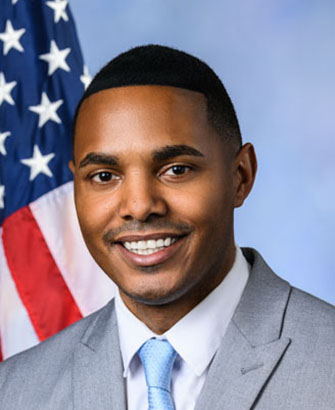 Ritchie TorresRepresentative, 15th districtDemocratic
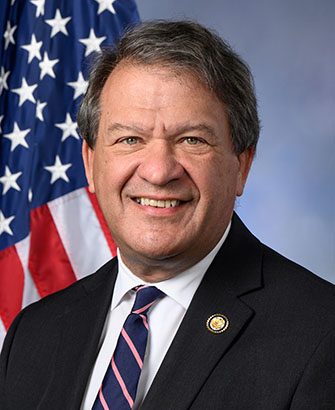 George LatimerRepresentative, 16th districtDemocratic
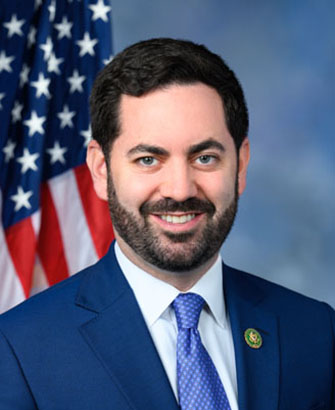 Michael LawlerRepresentative, 17th districtRepublican
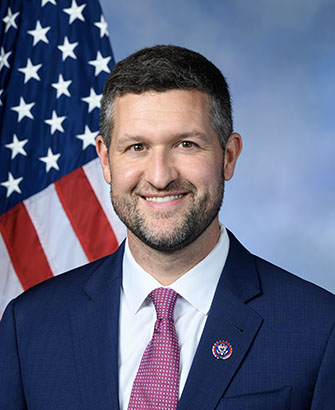 Patrick RyanRepresentative, 18th districtDemocratic
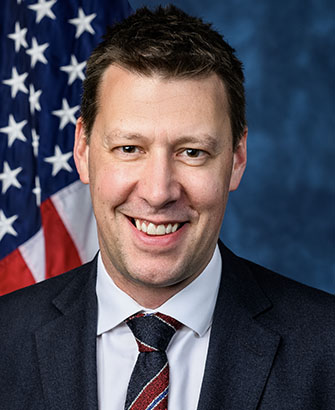 Josh RileyRepresentative, 19th districtDemocratic
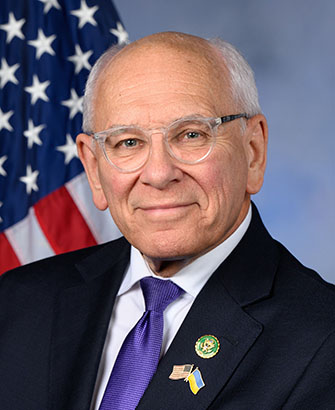 Paul TonkoRepresentative, 20th districtDemocratic
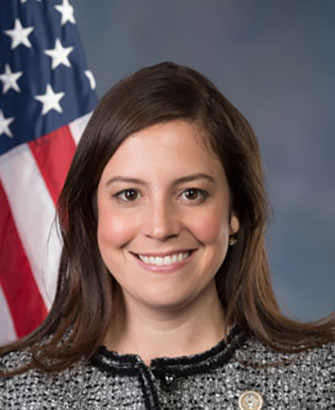 Elise M. StefanikRepresentative, 21st districtRepublican
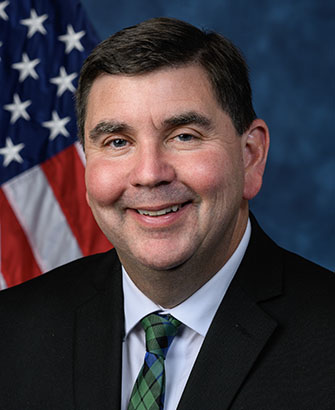 John W. MannionRepresentative, 22nd districtDemocratic
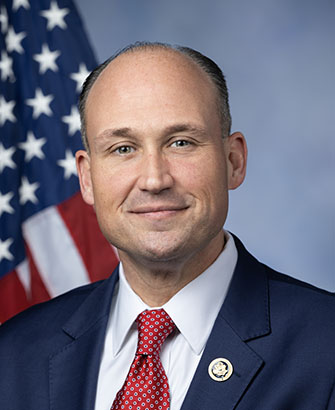 Nicholas A. LangworthyRepresentative, 23rd districtRepublican
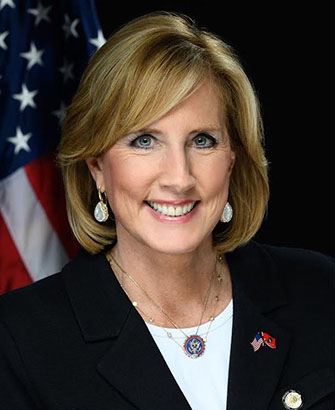 Claudia TenneyRepresentative, 24th districtRepublican
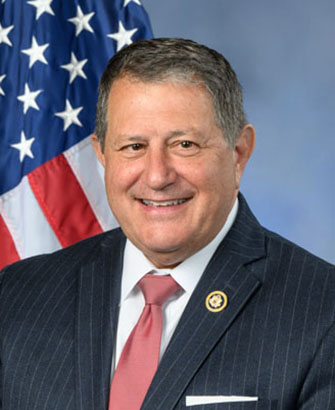 Joseph D. MorelleRepresentative, 25th districtDemocratic
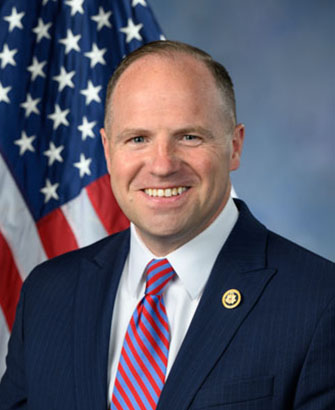 Timothy M. KennedyRepresentative, 26th districtDemocratic
Source: @unitedstates project (public-domain compilation of official congressional records) (retrieved November 21, 2026); Clerk of the U.S. House of Representatives (retrieved November 21, 2026); Biographical Directory of the United States Congress (retrieved November 21, 2026). Sitting members. Anyone elected on November 3, 2026 takes office on January 3, 2027.
Past elections in New York
Turnout and results from earlier elections. Open a section to see it.
Voter turnout
Ballots counted in each November general election as a share of people eligible to vote in New York.
| Year | Ballots counted | Eligible voters | Turnout |
|---|---|---|---|
| 2024 | 8,381,429 | 13,867,180 | 60.4% |
| 2022 | 5,962,278 | 14,001,265 | 42.6% |
| 2020 | 8,690,139 | 14,081,957 | 61.7% |
| 2018 | 6,230,959 | 13,766,275 | 45.3% |
| 2016 | 7,786,881 | 13,525,950 | 57.6% |
| 2014 | 3,930,310 | 13,490,728 | 29.1% |
| 2012 | 7,128,852 | 13,321,457 | 53.5% |
| 2010 | 4,763,899 | 13,105,474 | 36.4% |
| 2008 | 7,721,718 | 12,945,767 | 59.6% |
| 2006 | 4,703,830 | 12,730,240 | 37.0% |
| 2004 | 7,448,266 | 12,640,317 | 58.9% |
| 2002 | 4,690,968 | 12,555,284 | 37.4% |
| 2000 | 6,960,215 | 12,394,560 | 56.2% |
| 1998 | 4,989,877 | 12,256,410 | 40.7% |
| 1996 | 6,439,129 | 12,170,405 | 52.9% |
| 1994 | 5,325,323 | 12,188,299 | 43.7% |
| 1992 | 7,068,630 | 12,225,165 | 57.8% |
| 1990 | 4,290,261 | 12,270,687 | 35.0% |
| 1988 | 6,636,310 | 12,296,727 | 54.0% |
| 1986 | 4,481,718 | 12,268,721 | 36.5% |
| 1984 | 7,000,828 | 12,232,979 | 57.2% |
| 1982 | 5,437,367 | 12,115,273 | 44.9% |
| 1980 | 6,359,218 | 12,011,490 | 52.9% |
Source: University of Florida Election Lab (retrieved November 21, 2026). Every election from the first year with published figures for this state. Blank years say “not published”.
Presidential election results
Votes cast in New York in each presidential general election since 1976, most recent first.
2024 · 8,381,429 votes
- Kamala D. Harris · Democratic55.11% (4,619,195)
- Donald J. Trump · Republican42.70% (3,578,899)
- 15 other entries under 1% each2.18% (182,461)
2020 · 8,661,735 votes
- Joseph R. Biden Jr. · Democratic60.39% (5,230,985)
- Donald J. Trump · Republican37.46% (3,244,798)
- 22 other entries under 1% each2.15% (185,952)
2016 · 7,802,084 votes
- Hillary Clinton · Democratic58.40% (4,556,124)
- Donald J. Trump · Republican36.14% (2,819,534)
- Gary Johnson · Other2.26% (176,598)
- Jill Stein · Other1.38% (107,934)
- 4 other entries under 1% each1.82% (141,894)
2012 · 7,116,784 votes
- Barack H. Obama · Democratic62.84% (4,471,871)
- Mitt Romney · Republican34.92% (2,485,432)
- 6 other entries under 1% each2.24% (159,481)
2008 · 7,722,019 votes
- Barack H. Obama · Democratic62.22% (4,804,945)
- John McCain · Republican35.65% (2,752,771)
- Blank Vote/Scattering · Other1.10% (84,701)
- 6 other entries under 1% each1.03% (79,602)
2004 · 7,448,266 votes
- John Kerry · Democratic57.92% (4,314,280)
- George W. Bush · Republican39.78% (2,962,567)
- Ralph Nader · Other1.34% (99,873)
- 4 other entries under 1% each0.96% (71,546)
2000 · 6,960,215 votes
- Al Gore · Democratic59.02% (4,107,697)
- George W. Bush · Republican34.53% (2,403,374)
- Ralph Nader · Other3.51% (244,030)
- Blank Vote/Scattering · Other1.99% (138,216)
- 6 other entries under 1% each0.96% (66,898)
1996 · 6,439,129 votes
- Bill Clinton · Democratic58.33% (3,756,177)
- Robert Dole · Republican30.03% (1,933,492)
- Ross Perot · Other7.82% (503,458)
- Blank Vote/Scattering · Other1.91% (123,000)
- Ralph Nader · Other1.18% (75,956)
- 5 other entries under 1% each0.73% (47,046)
1992 · 7,079,432 votes
- Bill Clinton · Democratic48.65% (3,444,450)
- George H.W. Bush · Republican33.15% (2,346,649)
- Ross Perot · Other15.41% (1,090,721)
- Blank Vote/Scattering · Other2.16% (152,951)
- 4 other entries under 1% each0.63% (44,661)
1988 · 6,485,683 votes
- Michael Dukakis · Democratic51.62% (3,347,882)
- George H.W. Bush · Republican47.52% (3,081,871)
- 6 other entries under 1% each0.86% (55,930)
1984 · 6,806,810 votes
- Ronald Reagan · Republican53.84% (3,664,763)
- Walter Mondale · Democratic45.83% (3,119,609)
- 5 other entries under 1% each0.33% (22,438)
1980 · 6,201,959 votes
- Ronald Reagan · Republican46.66% (2,893,831)
- Jimmy Carter · Democratic43.99% (2,728,372)
- John B. Anderson · Other7.54% (467,801)
- 7 other entries under 1% each1.81% (111,955)
1976 · 6,668,262 votes
- Jimmy Carter · Democratic50.83% (3,389,558)
- Gerald Ford · Republican46.50% (3,100,791)
- Other · Other2.15% (143,037)
- 4 other entries under 1% each0.52% (34,876)
Source: MIT Election Data and Science Lab (retrieved November 21, 2026). Where a candidate appeared on more than one party line, the lines are added together. Entries under 1% are grouped.
U.S. Senate election results
The six most recent Senate contests in New York through 2024. A runoff, where one was held, decides the seat.
2024 general election · 8,381,397 votes
- Kirsten E. Gillibrand · Democratic56.22% (4,711,669)
- Michael D. Sapraicone · Republican38.74% (3,246,690)
- Undervotes · Other4.36% (365,232)
- 3 other entries under 1% each0.69% (57,806)
2022 general election · 5,848,556 votes
- Charles E. Schumer · Democratic56.78% (3,320,561)
- Joe Pinion · Republican42.77% (2,501,151)
- 1 other entry under 1% each0.46% (26,844)
2018 general election · 6,055,151 votes
- Kirsten E. Gillibrand · Democratic67.00% (4,056,931)
- Chele Chiavacci Farley · Republican33.00% (1,998,220)
2016 general election · 7,800,725 votes
- Charles E. Schumer · Democratic66.94% (5,221,949)
- Wendy Long · Republican25.76% (2,009,353)
- Blank Vote · Other5.14% (400,943)
- Robin Laverne Wilson · Other1.45% (113,413)
- 3 other entries under 1% each0.71% (55,067)
2012 general election · 7,116,628 votes
- Kirsten E. Gillibrand · Democratic67.57% (4,808,878)
- Wendy Long · Republican24.67% (1,755,466)
- Blank Vote/Void Vote/Scattering · Other6.41% (455,963)
- 3 other entries under 1% each1.35% (96,321)
2010 general election · 4,763,899 votes
- Charles E. Schumer · Democratic63.98% (3,047,880)
- Jay Townsend · Republican31.08% (1,480,423)
- Blank Vote/Scattering · Other3.53% (168,384)
- 2 other entries under 1% each1.41% (67,212)
Source: MIT Election Data and Science Lab (retrieved November 21, 2026). Primary elections are not included. Entries under 1% are grouped.